Introduction
There are various methods to monitor query performance in SQL Server. One of the best ways is to analyze the query execution plan and identify the queries that can cause performance bottlenecks. Sometimes, query execution plans get changed during the query execution due to certain factors of SQL Server. Then there is a need to understand this behavior, so you can review the query execution plans to identify the change and understand the overall performance. This can be done only if your system is persisting the required information for later analysis. The Query Store feature in SQL Server 2016, SQL Server 2017 and Azure SQL Database version provides the capability to store query execution plan information and gives you the opportunity to analyze it.
The Query Store captures a history of queries and execution plans, and runtime statistics. This information persists within SQL Server and can be reviewed later. The available information helps database professionals to troubleshoot the performance differences caused by changes in the query execution plan. In addition, in recent releases of SQL Server, Microsoft enhanced the Query Store capabilities. In SQL Server 2017, a couple of execution metrics included Log memory, TempDB memory, and Wait times. With this, you can backtrack the actual query that is hurting the performance.
Query Store
We know that execution plans for a query in SQL Server change over the period due to a change in statistics or a change in schema or a change in the index (create or delete), etc. As a result, query performance regressions caused by execution plan changes can be difficult and require lot of time to troubleshoot.
The main purpose of Query Store is to persist multiple execution plans for each query and use plan forcing. Plan forcing can resolve a query performance regression caused by execution plan changes in a short time. Plan forcing directs the query processor to select and use a specific query execution plan for the query. Another benefit, plan forcing is transparent to applications and doesn’t require any change in applications.
Query Store Capabilities
The Query Store feature helps to capture a lot of execution metrics and uses static functions like Min., Max., Total, etc. to understand the overall query behavior. The key metrices are CPU time, Duration, Execution Count, Logical Reads, Logical writes, Memory consumption, Physical Reads, CLR time, Degree of Parallelism (DOP), and Row count. In the latest version of SQL Server 2017, there are additional metrices available like Log memory, TempDB memory, and Wait times. The wait statistics are another source of information to backtrack the performance issue to the actual query in SQL Server. Wait times or wait statistics provide you quick in-sight to identify the high cost queries. For example, queries with high memory wait, queries with high lock wait, queries with a high number of physical reads, and queries with high CPU consumptions.
Query Store – Configuration
We can configure Query Store using SQL Server Management Studio (SSMS). You need to right click on the database instance. You will get the below pop up box; select query store option from left pane of box:
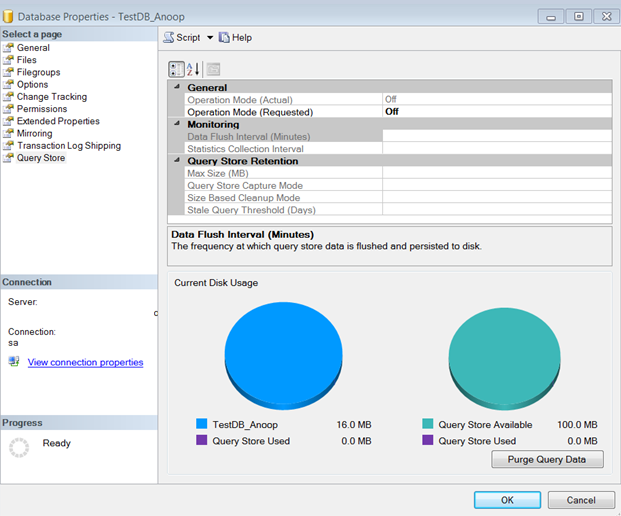
Figure 1 – Opening Query Store properties using SSMS
To enable Query Store, you need to select the option given in the drop down; Read Only or Read Write; by default, it will be Off.
As you want to capture query execution behavior and plans history; choose the Read Write option.
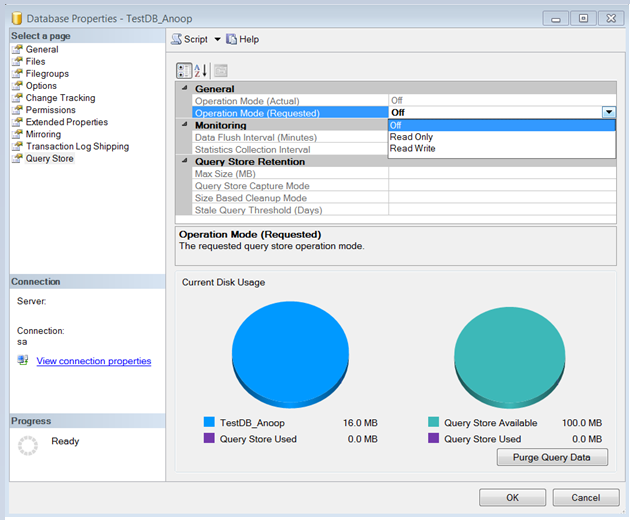
Figure 2 Enable Query Store and Choose Operation Mode
In next set of configurations, you need to choose options for monitoring timing, how frequently you want SQL Server to capture the information; by default, the values are 15 min. and 1 hour.
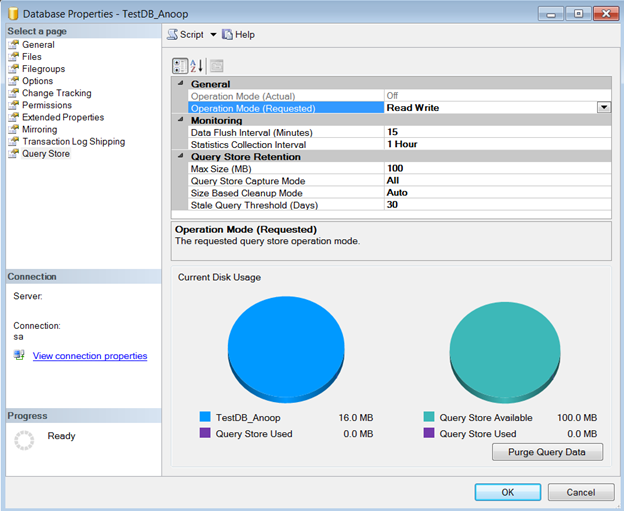
Figure 3 Set up Query Store Monitoring Timing
I would recommend changing Data Flush to 5 minutes and Statistics Collection Interval to 30 minutes to get more granular information.
In the next section, you need to choose the option to retain the results captured by Query Store. In the first option Max Size, you need to allocate space to store the information; by default, the value is 100 MB, which you can increase to at least 1024 MB to avoid any other issues during the process.
The next option is Query Store Capture Mode. By default, the value is All; you can keep the same to get the overall load information.
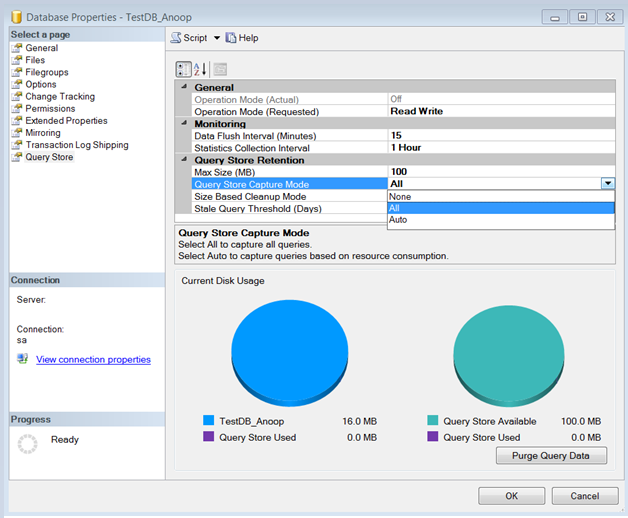
Figure 4 Set up Query Store Retention Values
In the next option, you need to define the Cleanup Mode; this helps you to control the Query Store behavior, if Query Store data size reaches the limit. I would recommend keeping this option on Auto as this will provide you with the latest data.
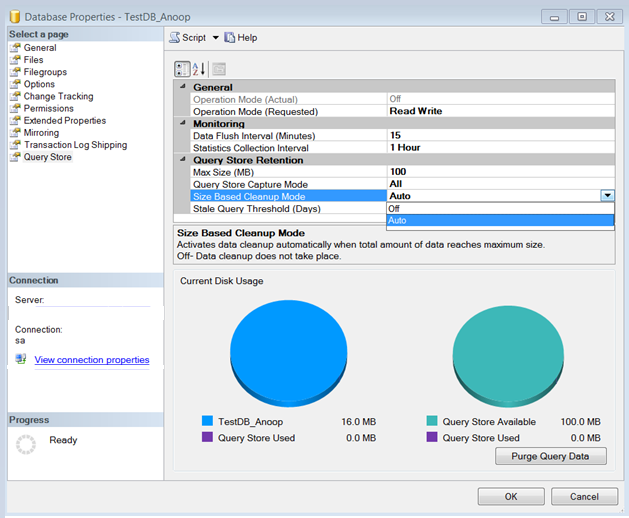
Figure 5 Set up Query Store – Size Based Cleanup Mode
The next option, Stale Query Threshold is important. This is the setting to retain the captured information; by default, it is 30 days. I would recommend keeping this at 90 days. This will give time to manage historical information and more time for analysis.

Figure 6 – Query Store Stale Query Threshold
Also, you can use Purge Query Data at any point of time. A button is given in the bottom of the box to purge/clean the history.
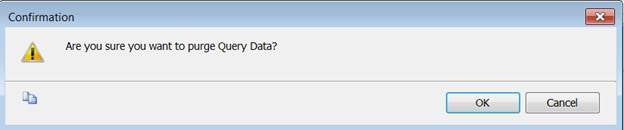
Figure 7 – Purge Query Store History Data Message Box
Performance Analysis using Query Store Queries
After completing the configuration of Query Store, SQL Server will start capturing the information. You can visit the Query Store option in the Database hierarchy using SQL Server Management Studio. Once you expand the Query Store option you will see a couple of pre-configured queries are already available for your reference.
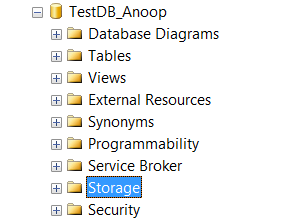
Figure 8 SQL Server Database Hierarchy Before Enable Query Store
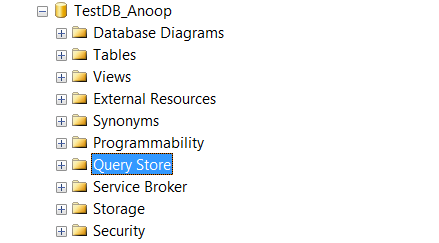
Figure 9 SQL Server Database Hierarchy after Enable Query Store
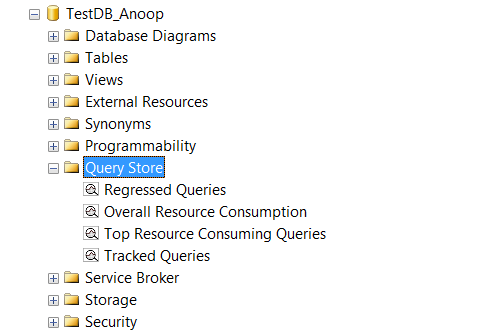
Figure 10 Query Store Queries Options
You can choose these queries one by one to understand the behavior of queries executed on the database.
Open the Regressed Queries pane in Management Studio. The Regressed Queries pane shows you the queries and plans available in the query store. This gives you a lot of options for analysis and understanding the work load. You can use the top drop-down boxes to select queries based on multiple criteria. For example, you can select a plan to see the graphical query plan, buttons are available to view the source query, force, and unforce a query plan, and refresh the display.
Similarly, you can review other query options like Overall Resource Consumption, Top Resource Consuming Queries and Tracked Queries available in Query Store.
Summary
The Query Store is one of the best features available in the latest versions of SQL Server – SQL Server 2016, SQL Server 2017. This feature is available in the cloud version of SQL Server too – Azure SQL Database. Using this feature, you can ease your performance troubleshooting and find the best possible resolutions in a short period of time. This feature not only provides the opportunity to capture and retain the history of query execution, it also gives you the option to force your best solution to avoid future bottlenecks.