Introduction
Microsoft Power BI is a cloud based self-service BI solution for the enterprise. Power BI provides capabilities that can be leveraged by people with all level of skills including data analysts, power users, business users, data stewards and folks from the IT department.
Recently, under the Power BI umbrella, the team added another tool called Power BI Designer to quickly build reports or dashboards locally and deploy it to the Power BI site. In this article, I demonstrate how to get started with Power BI Designer.
Getting Started with Power BI Designer
Power BI Designer is a powerful and flexible tool that empowers users to create intuitive reports or dashboards easily and quickly and lets users change visual views of the data at their fingertips for better analytics. It features drag-and-drop capabilities to place content exactly where you want it on the report canvas in a well-structured layout.
Power BI Designer is a powerful tool with which you can create data connections to pull data from various sources, create a collection of queries for your data analytics, build a robust data model based on data retrieved and create visually appealing reports or dashboards in minutes.
Once you are done with creating reports or dashboards in Power BI Designer, you can quickly deploy them to the online Power BI service to share with others for better collaboration and to get a deeper insight into the data.
To get started with Power BI Designer, you need to first download it from here or here. Double click on the downloaded msi file to install it; follow the installation steps and once you are done with installation, you can launch the Power BI Designer, which should look like the image below. By default, when you launch Power BI Designer, you will see the start-up screen with some quick videos and links to quickly get started with it (you can disable it if you don’t want the start-up screen to be shown the next time you open Power BI Designer by un-checking the check-box on the start-up screen).
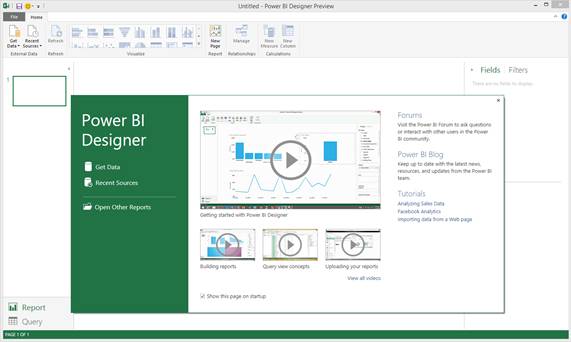
Launch Power BI Designer
Now click on the Get Data link in the start-up screen (you can also click on the Get Data icon in the ribbon) and you will see different types of sources, which you can use to pull data for creating reports in Power BI Designer as shown in the image below.
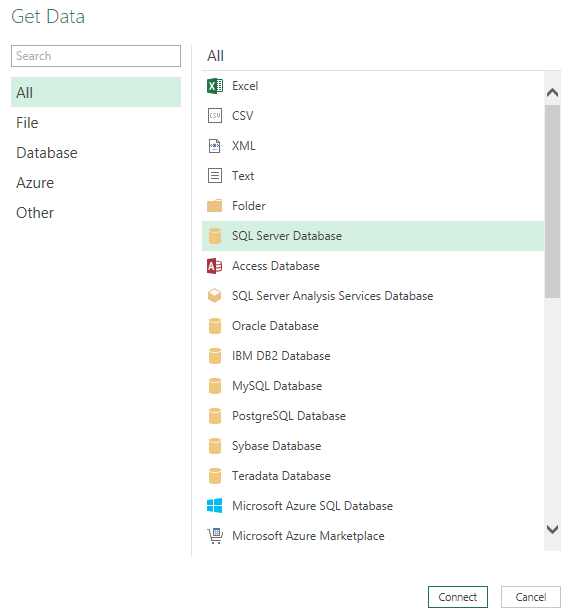
Get Data
As I wanted to pull data from SQL Server for this demonstration, I chose SQL Server Database as shown in the image above. Clicking on the Connect button will launch the wizard; the first screen of the wizard, to pull data from SQL Server, should look like the image below. You need to specify the SQL Server instance name, optionally a database on the specified instance or SQL queries that you want to pull data from the SQL Server.
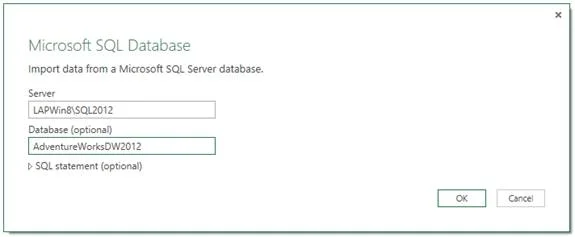
The First Screen of the Wizard
If you don’t specify the query, the next screen of the wizard will give you an option to choose from available tables or views as shown below. In my case I chose AdventureWorksDW2012 database and DimGeography, DimSalesTerritory and FactInternetSales tables as shown below.

Choose from Available Tables or Views
Click on the Load button to start pulling data from the source into Power BI Designer; once it is completed, you can see these tables in the Fields list, as shown below, available by default on the right side of the designer.
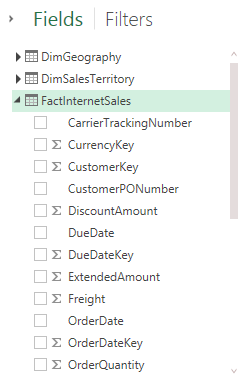
Fields List
If you are working on more than two tables or datasets, you can define relationships between them so that you can query across these tables or datasets. To setup relationships, you need to click on the Manage icon in the ribbon. In the Manage Relationship screen you can now define the relationships. In my case, as I am pulling these tables from a single source and the relationships have been defined at the source itself, Power BI Designer detects it automatically as shown below (or you can click on Auto-Detect button).
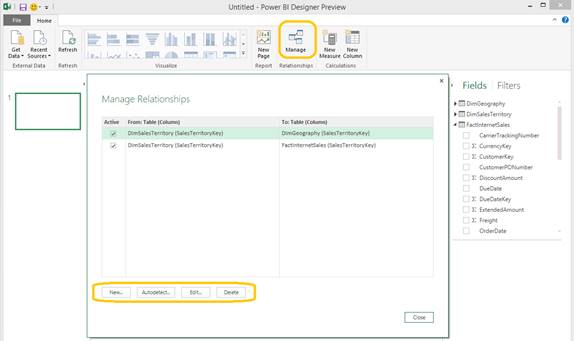
Manage Relationships
That’s all, now you can drag and drop fields from the Fields list on the report canvas and Power BI Designer appropriately picks up the visualization type and will show it. In case you want to change the visualization, click on the tiny Change Visualization type icon on the right top of the selected visualization and change to any available visualization.
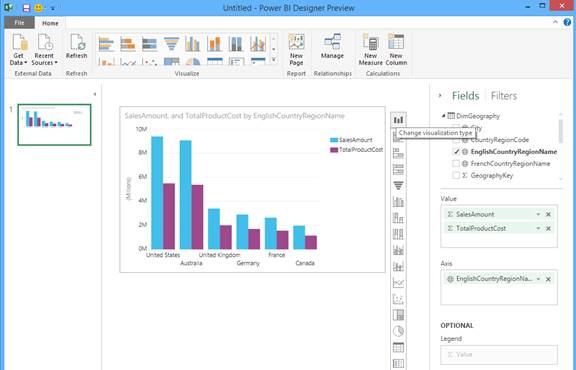
Change Visualization Type
For the same sets of data you can have different visualizations. To do that either you can drag-drop fields from the Fields list again or copy paste an existing visualization and change it to another type. These visualizations are going to be linked together and hence if you filter or highlight any one of them, the others will also get filtered or highlighted accordingly. For example, as I filtered or highlighted United Kingdom in the first chart, the second chart also highlights data for United Kingdom.
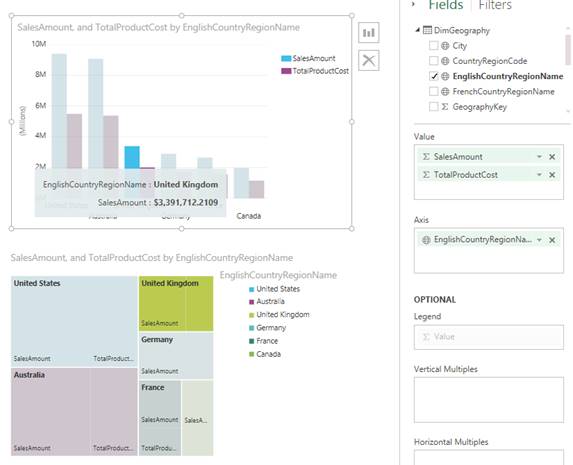
Different Visualizations
You can also create multiple pages or report canvases in your single Power BI Designer file to have different visualizations in them. To do that, simply click on the New Page icon in the ribbon. As you can see in the image below, I created another page with a world map to show sales amount by country on the map.
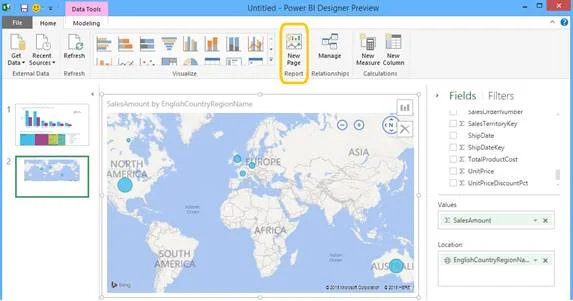
New Page
Once you are done with creating reports or dashboards in the Power BI Designer, you can save the file. To publish it to the Power BI site or to share it with others, you can go the Power BI site, click on the Get Data link, select Power BI Designer File from the available options and then click on the Connect button as shown below. Browse and select the saved Power BI Designer file (with pbix extension) and click on Connect to start uploading file.

Publish to the Power BI Site
Once uploaded, you can go to Power BI site and you will see your uploaded file there. You can now share it with others for collaboration.
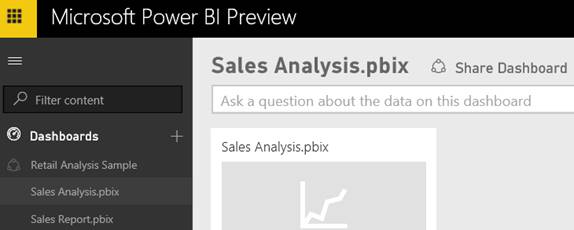
Uploaded File
Under the Reports node, you can see your reports, which you can visualize or even edit in a browser as shown below.
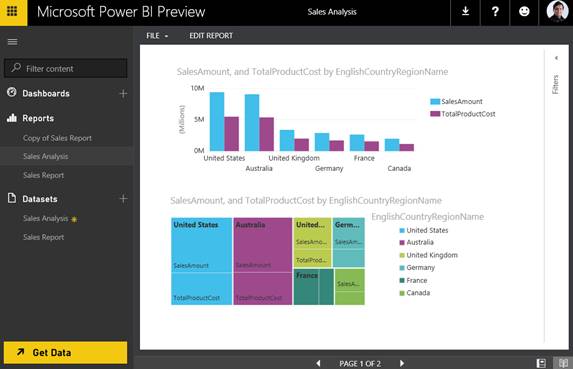
Reports Node
Power BI has a great feature called Power Q&A, which allows you to ask questions in natural language and get answers back promptly, presented to you in different visualization options based on the data in the model you have uploaded (in this case within the Power BI Designer file). One of the examples of Power Q&A is shown below.

Power Q&A
Please note, Power BI and Power BI Designer is in its preview stage right now; features mentioned in this article might change in the final release.
Conclusion
Power BI Designer is a powerful and flexible tool (under the Power BI umbrella), which empowers people with all level of skills including data analyst, power users, business users, data stewards and folks from the IT department to create intuitive reports or dashboards easily and quickly and then deploy it to the Power BI site for sharing and collaboration. In this article, I demonstrated how to get started with Power BI Designer.
Resources
Understanding Microsoft Power BI – Self Service Solutions