Summary
This article shows you how you can use Microsoft Access 2007 as a basic data mining tool for exploring your valuable data. In the article, we will illustrate how data filters, pivot graphs, queries in graphs and filters in reports can help this cause.
What Is Data Mining
Professionals will tell you data mining is the use of automated techniques to establish useful trends/information in the database(s) that organizations have spent fortunes acquiring. Once derived, this information is then used to improve business practices or make better business decisions. The techniques that are involved are many and include analysis by association, clustering, classification, fuzzy logic, neural networks and data cleansing. These techniques then are coupled with visualization tools ranging from reporting, graphing, OLAP and others. Why not find out more by heading to one of the data mining aggregate sites such as http://www.kdnuggets.com/
Having a professional approach to data mining is great, but what about the rest of the population (the other 99%) who neither understand data mining nor have the time and money to get professional data mining tools working on their databases. What can they do?
Why not use the popular Microsoft Access tool to explore our databases rather than a new tool. Firstly, Access is tightly integrated with the charting tools used in Microsoft Office/Excel. (See Figure 1). The charting tools used by Access are similar to the tools used by Excel; the main difference is that Access uses queries where Excel refers to cells. Secondly, Access supports industrial strength SQL queries, and through Links, can be used as a client application to any variety of databases ranging from text files, spreadsheets, SharePoint Lists, SQL server, Oracle, MySQL etc. On top of that, well designed forms & VBA can help you establish an interface that will give your users the confidence to start investigating their data by themselves.
In Access 2007 there have been some new innovations that will help people explore their data. This includes very similar interfaces for data filtering in Access 2007 and Excel 2007; pivot charts, pivot tables are prominent in the user interface and interactive filters are now available in Access reports.
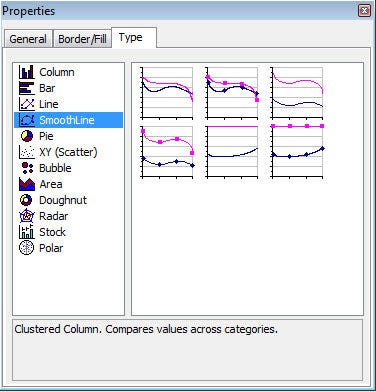
Figure 1 – A sample of the range of graph styles available in Pivot Charts
Before I start showing examples of the different tools, Figure 2 show the sample data that I have used to create the figures in this article.

Figure 2 – The sample data
Filtering Data in Queries and Forms
So how are we going to use Access as a data mining tool? Well the truth is that since Access 95 came out with Filter By Selection and Filter by form for both tables and queries, a basic set of data exploring tools has been available in queries and forms.
For example, Filter by Selection is a primary example of a how you can explore your data. By right clicking on the year (say 2008) and choosing Filter by Selection, you will show only sales for that month. This Filter by Selection is in essence one of the most important data mining techniques – a drilldown. It is into this framework that the changes to the filtering user-interface in Access 2007 to match Excel data filtering has made Access a more universal tool. This is illustrated in Figure 3 where the new filtering interface is demonstrated.
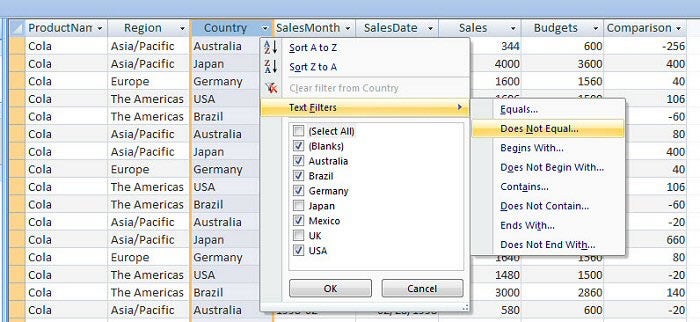
Figure 3 – Filtering in Access 2007 is now very similar to Excel
Adding Totals in Queries
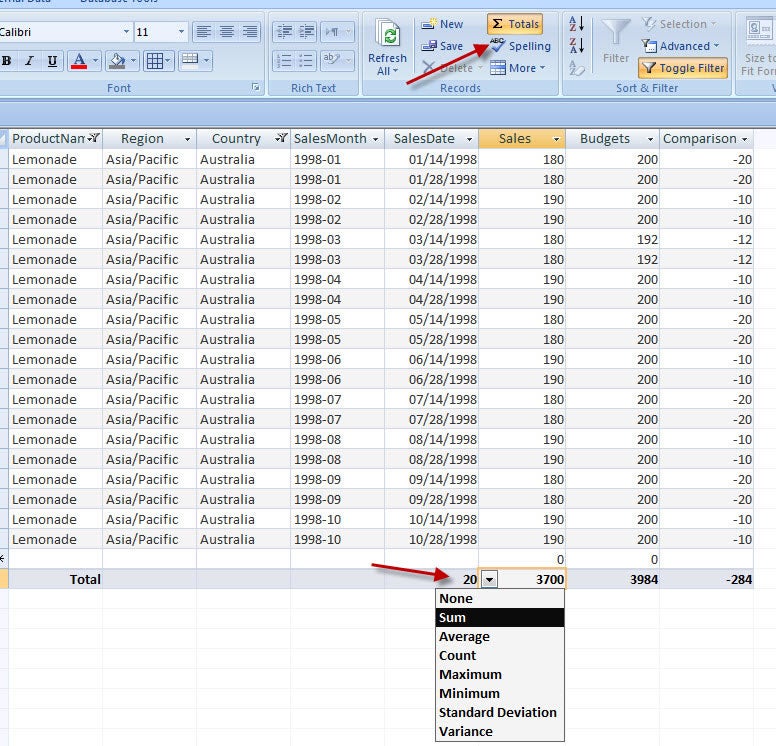
If you like filtering data, then there is one great new innovation that will answer many of your data questions and that is Totals. When you have a query open, in the Home Ribbon you will find a Totals button. Click on this and an extra row will be added to your query as shown in Figure 4. Now you can right click in that new Row and add Sums or Averages or Counts like those that I have done. For me this innovation is really useful as I was forever copying and pasting to Excel to compute totals after filtering.
Figure 4 - Adding a Totals row to an Access query reduces the need for extra reports or copying to Excel
Turning Your Queries into Pivot Tables for Further Investigation
In earlier versions of Access, when you looked at the data in a query, you could do little else in the query interface apart from Sort and Filter. In Access 2007, you now can turn the Query into an instant interactive Pivot grid view with lots of further data exploration options. If you have a look at Figure 5, you will see the interface that you get when you view the query in this manner. In addition, when you switch from an ordinary query view to the PivotTable view, the filters that you have already used are maintained.
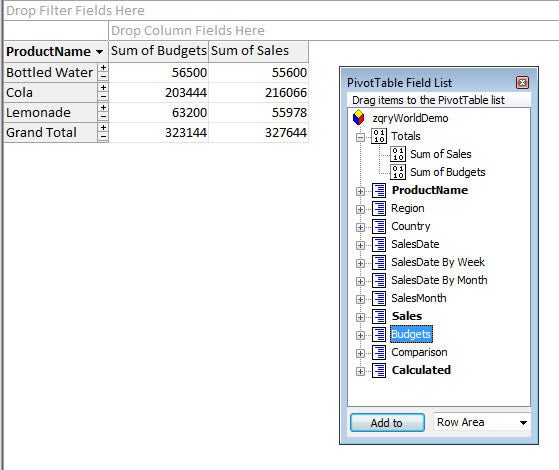
Figure 5 – Viewing queries in Pivot Table View
Turning Your Queries into Pivot Charts for Further Investigation
As well as viewing queries directly as Pivot Tables, you can view them as Pivot Charts and use the same field and filtering interface as the PivotTable. Whilst this too is a valuable tool, it will require the user to understand queries to ensure that the data that is being extracted is suitable to the chart views. This is one area where it is good for the Access expert who understands the database model to sit down with the charting user to ensure that they are getting the information in the right way. Usually just one or two good samples are enough to fire the creative juices of the power user. In addition, if you tell the power user that the pivots views work the same as Excel Pivots, they will get motivated.
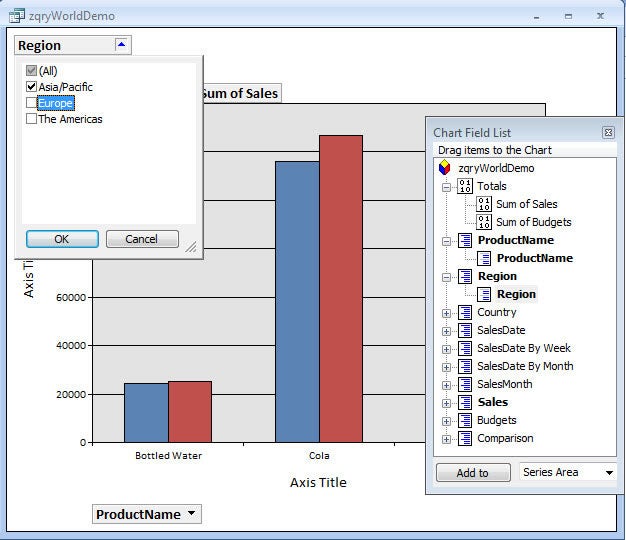
Figure 6 – Viewing queries as charts in PivotChart view
Note that you can incorporate Pivots into Forms and Reports as subforms but you have to set the default view property of the subform to the correct view and allow that type of view.
Filtering Reports on the Fly
When it comes to software, I always find that the best innovations are ones that extend a popular technique rather than ones that force you to understand a new technique. In Access 2007, reports can now be filtered as they are being displayed; this allows you to make your reports more powerful with almost no changes. To make this work, you can bring up the filtering options (which work just like queries) by right clicking on a field in the report as I have done in Figure 7.
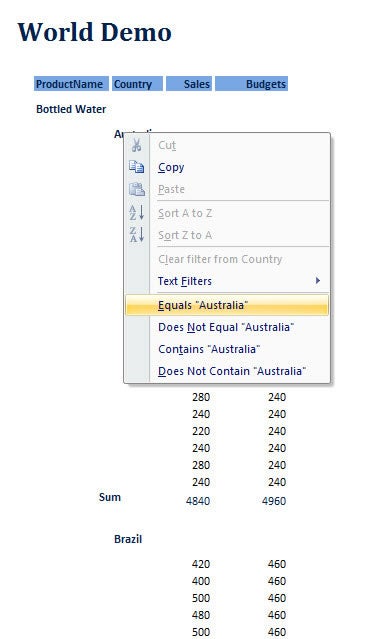
Figure 7 – Exploring data by filtering an Access 2007 report
Microsoft Graphs
Now the final way that you can explore data uses Microsoft Graph and this is more the realm of the professional programmer. With MS Graph, when you have a large amount of data, it is totally impractical to review data as individual records. So with MS Graph objects, you will almost always use consolidation queries (group by) for two dimensional graphs and crosstab queries which allow you to display the data in three dimensions.
For example, this consolidation query computes the Bottled Sales by Month for “The America’s” and this query can be used to provide the row source for a Microsoft Graph.
SELECT Format([SalesDate],"mmmm") AS Months, Sum(Sales) AS SumSales
 FROM zWorld_Demo
 WHERE (((Region)='The Americas') AND
 ((ProductName)='Bottled Water'))
 GROUP BY Format([SalesDate],"mmmm");
Conclusion – So How can you Start Exploring Your Database
The trick for professionals to getting these tools to work is understanding the data model, establishing appropriate queries and fitting them into the user interfaces. The trick for Power users is probably to get the developers to setup a good sample of the correct tool with a similar query and then using that as a prototype to explore your data. What ever your approach, you will agree after seeing these options that Access 2007 has added some really cool and useful tools for the amateur data miner.
Reference: Garry’s earlier article on Microsoft Graph can be found here
» See All Articles by Columnist Garry Robinson


