Introduction
Power Map is an Excel add-in under the Microsoft Power BI umbrella that extends the capability of Power View by enabling end users to visualize data in a 3D visualization format. It lets you plot geographical and temporal data visually, analyze it in 3D visualization format and create an interactive, guided cinematic tour to discover new insights by seeing your data in geographic space and seeing time-stamped data change over time (which you might not have seen in traditional 2D tables and charts) and to share it with others.
In my last article, Understanding Microsoft Power BI – Self Service BI Solutions, I talked in detail about Microsoft Power BI self-service solution and its different components.
In this article, I am going to talk about Power Map in detail, how to install it and how to get started using it.
Installing Power Map Excel Add-in
The Power Map (code name for this feature was “GeoFlow”) is a free Excel add-in (supported in Excel 2013) that can be installed from the Microsoft Download Center. To install Power Map Excel add-in, you require Microsoft Office 2013 Professional Plus, Office 365 ProPlus. You can find more information on this, under Software Requirements section in the Microsoft Download Center
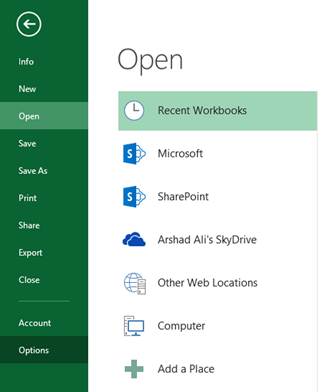
Once installed, you need to go to the File menu and click on Options as shown below, to enable the add-in for use:
Enable the Add-in
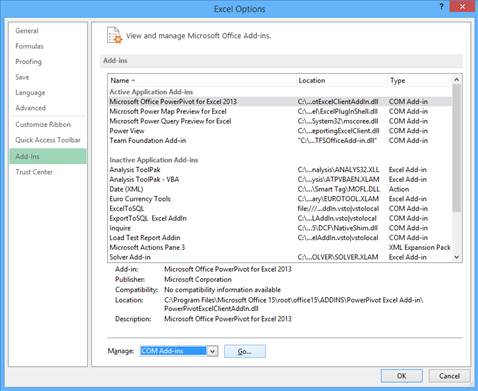
Click on Add-Ins tab on the left side and then from the Manage combo-box, select COM Add-Ins as shown below and the click on Go button:
Manage COM Add-ins
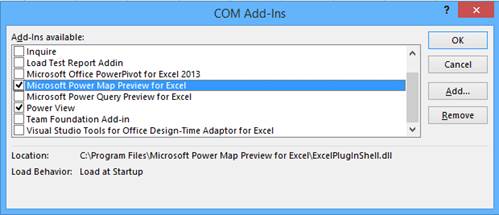
On the COM Add-Ins dialog box, check “Microsoft Power Map Preview for Excel” and then click on OK button:
Microsoft Power Map Preview for Excel
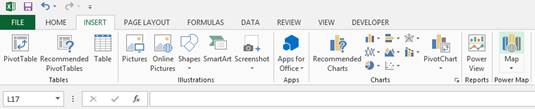
Now if you go to INSERT tab, you will notice the Map icon appears on the right side of the image, as seen below:
Map Icon
Getting Started with Power Map for Excel
Power Map provides interactive, 3D visualization with geospatial and temporal data. It enables information workers to discover and share new insights from data through rich, 3D visualization on a globe with fluidic appearance, guided cinematic tours and seeing time-stamped data change over time (which you might not have seen in traditional 2D tables and charts) and to share it with others.
Power Map is one of the Excel add-ins available as part of Microsoft Power BI – a cloud based self-service BI solution for the enterprise – for visualization of the data in a completely different way. Power Query is another add-in, which provides an intuitive and interactive user interface that can be used to search, discover, acquire, combine, refine, transform and enrich data. I am going to use Power Query to search some data and then use the same data for visualization in Power Map.
To search data online, click on the Online Search icon under Power Query tab as shown below:
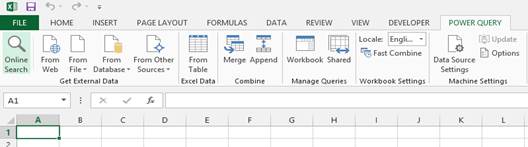
Online Search Icon
In the text box of Online Search, I searched for “India population” and here is the result of my search. I also see one result for the state wide literacy rate for Indian form Wikipedia. Let me use this data to visualize it in the Power Map with 3D visualization:
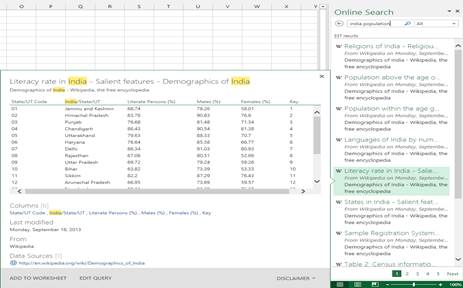
Online Search Results
Once you have installed the Power Map and enabled it (as discussed above), you need to go to the Insert tab and then click on the Map icon and then click on Launch Power Map as shown below:
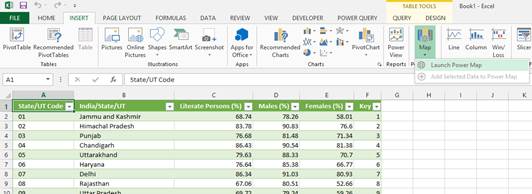
Launch Power Map
And this is what the Power Map report designer interface should like; you can see one default scene already created on the left side and on the right side you can see the interface, which shows the structure of your data. In the middle, you can see the globe where your data will be plotted.
When we start creating a Power Map report, first of all, we need to map the geography or geospatial data.
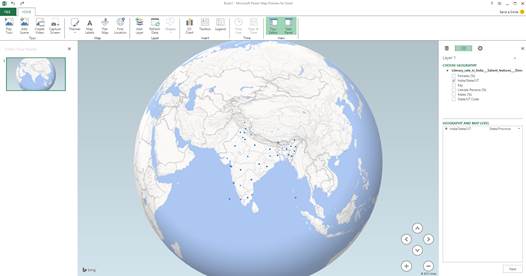
Map the Geospatial Data
In the result-set, I have Indian state names as geography data and hence I have mapped it with State/Province as you can see below. Your data can contain other geospatial data that can be mapped here like latitude, longitude, city, state, country, zip, address, etc.
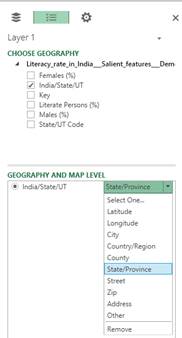
Geospatial Data
Once you have done with this mapping, click on the Map it button to move onto the next screen where you need to identify the column you want to analyze. I want to analyze Literate Persons percentage (with each column or measure you can specify the aggregation function; in my case as I have calculated percentage already in my data and hence I have not used any aggregation function) in my map report as heat map and hence I have selected it as shown below:
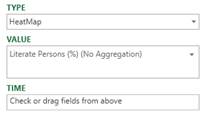
Identify the Column to Analyze
And this is how the heat map report looks for the literate persons percentage in Indian states as per data I have in the excel workbook.
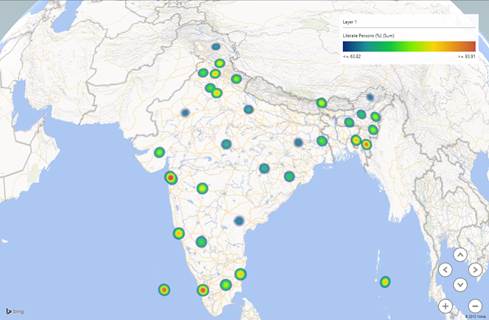
Heat Map
In the next view, I changed the report type to column or bar and added male literacy percentage and female literacy percentage along with the total literacy percentage as before. And in just a few seconds, I have a different Power Map report view in 3D format as you can see below. The best part of this report is, it’s fully interactive 3D visualization on a globe with fluidic appearance; you can zoom-out, zoom-in, move in different directions, etc. If you hover over any of this bar, you can see its value:
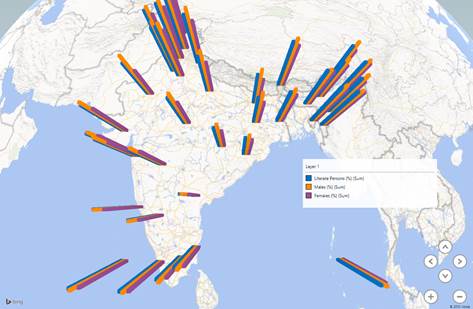
Power Map Report
Well suppose you don’t like the above report and you want to change it to be pie-charts, very similar to what is shown below. For that you just have to change the report type and that’s all; with a single click you have a different visualization to gain insights:
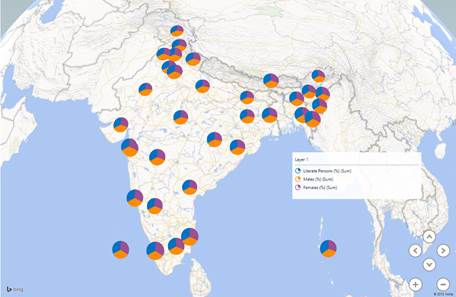
Pie Charts
As I said before, Power Map allows you to create cinematic effects on a globe with fluidic appearance; to do that you can create different scenes (each scene might have multiple layers). For example, as you can see below, I have created three different scenes. The first scene, for total literacy percentage, the second sheet for male literacy and the third sheet for female literacy visualization. Once you are done with creating these scenes, you can click on the Play Tour icon as shown below for a nice fluidic cinematic tour in 3D format. This gives a really nice visual treat to the eyes and at the same time better insights into your data. As I said before it’s fully interactive so you have control to zoom-in, zoom-out, and move in different directions to visualize your data from different directions.
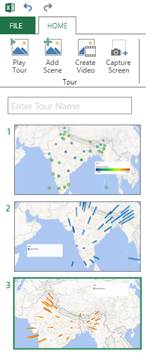
Play Tour
There are couple of other options in the Power Map report designer, like you can change the theme of the report, add map labels, analyze data in flat map instead of globe, find any specific location on the map using search, add text boxes for comments or annotations, etc.
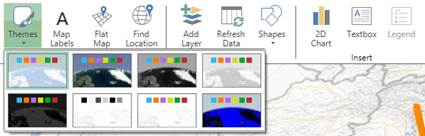
Power Map Report Designer Options
For example, as you can see below I added map labels and place names to the report. This gives an even better clarity on the place or location:
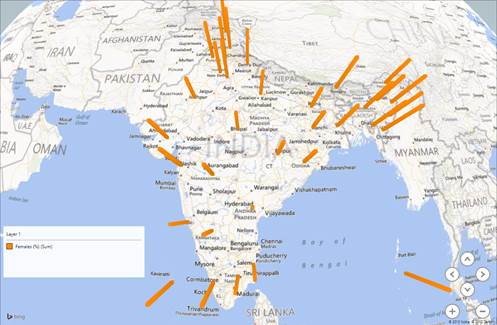
Map Labels and Place Names
Power Map reports are saved as part of your Excel document. When you open the Excel document and click on Launch Power Map, it will give this dialog to choose if you want start an already existing tour (saved as part of Excel document) or you want to start a new tour of creating Power Map report.
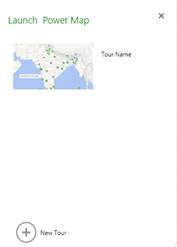
Launch Power Map
If you have data with a time dimension, you can place time dimension under Time in the Power Map designer and can see your report (time-stamped data) changing over the period of time when you play it.
Please note, Power Map is in Preview stage right now and features mentioned in this article might change in final release of the product.
Conclusion
Power Map is an Excel add-in under the Microsoft Power BI umbrella that extends the capability of Power View by enabling end users to visualize data in 3D visualization format. It lets you plot geographical and temporal data visually, analyze it in 3D visualization format and create interactive, guided cinematic tours to discover new insights by seeing your data in geographic space and seeing time-stamped data change over time and to share it with others. In this article, I talked about how to install the Power Map Excel add-in and how to install, enable and get started with using Power Map.
Resources
Power BI for Office 365
Understanding Microsoft Power BI – Self Service BI Solutions
GeoFlow Takes Data for a 3-D Drive
Power Map Sample Workbooks